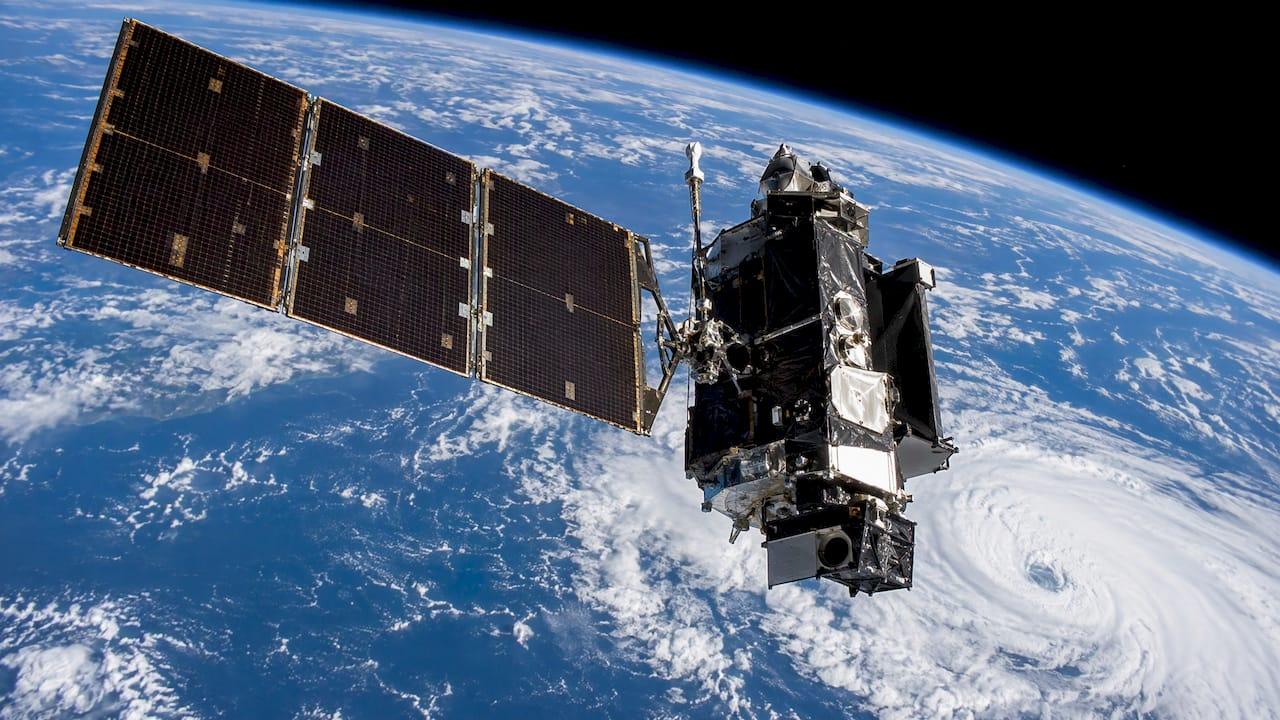
Satellite weather data is the stream of measurements that orbiting spacecraft collect about clouds, temperature, moisture, wind, precipitation, ocean surface conditions and more, delivered as images and as calibrated physical quantities. It is free to view, much of it is free to download, and it is the backbone of modern forecasting. Reading it well is a different skill from looking at it, and that gap matters most when a decision, a contract or a claim depends on what the atmosphere actually did.
This guide explains what the data contains, how the two main satellite types differ, which products exist, where to get them, and how professionals combine them with other observations for event planning, risk assessment and after-the-fact reconstruction.
TL;DR
- Weather satellites measure visible and infrared radiation, plus microwave sounding data, and from these derive cloud-top height, rainfall estimates, winds, sea surface temperature, fire detection and more.
- Geostationary satellites watch one hemisphere continuously and suit real-time storm tracking. Polar-orbiting satellites pass over each area a few times a day and suit detailed global datasets.
- Satellite data has known limits, such as cloud interference with infrared soundings and coarse vertical detail, so it works best alongside radar, surface stations and models.
- Raw imagery does not tell you what a storm means for your venue, route or claim. A consulting meteorologist turns it into a decision or a defensible report.
Table of Contents
- What satellite weather data actually is
- Geostationary versus polar-orbiting satellites
- The products behind the pictures
- Where to get satellite weather data
- What satellite data does well, and how professionals handle its limits
- Using satellite data to plan events and manage weather risk
- Reconstructing weather after the fact
- Perspective: why raw satellite data is not an answer
- How we can help
- How to read a satellite image with more confidence
- FAQ
- Sources
What satellite weather data actually is
A weather satellite carries instruments that record electromagnetic radiation reflected or emitted by the Earth and its atmosphere. According to the Met Office, satellites provide images in both the visible and infrared parts of the spectrum. Visible images are useful in daylight, while infrared imagery lets you observe the atmosphere at night and measure the temperature of cloud tops and the Earth's surface.
Images are only the most familiar output. The Royal Meteorological Society notes that weather satellites carry radiometers for imagery, along with spectrometers and interferometers that measure temperature and humidity. From these, forecasters can identify rain-bearing clouds, infer wind speed and direction, reveal sea surface temperature, measure sea ice and snow cover, and track hurricanes, dust storms, pollution and volcanic ash.
Sounders add a vertical dimension. The Met Office's weather satellite factsheet explains that sounders working in the microwave and infrared bands measure radiation emitted from different levels of the atmosphere. Microwave radiation is insensitive to most cloud types, so it gives much better coverage down to the surface than infrared does.

From radiance to a usable product
Data reaches users in stages. The NOAA Beginner's Guide to GOES-R Series Data describes the levels this way:
- Level 0: observations received directly from the instruments.
- Level 1b: calibrated and, where applicable, geographically corrected data in standard physical units, which are radiances for the Advanced Baseline Imager (ABI).
- Level 2 and above: environmental quantities such as cloud-top height or land-surface temperature, derived by algorithms.
Knowing which level you are looking at is the first step in interpreting it. A pretty loop is usually a Level 1b rendering. A rainfall estimate is a Level 2 product with its own assumptions and error characteristics.
Geostationary versus polar-orbiting satellites
The two orbit types answer different questions, and most professional work uses both.
| Feature | Geostationary | Polar-orbiting |
|---|---|---|
| Altitude | About 22,300 miles (35,800 km) above the equator, per NESDIS figures reported in our research | About 540 miles (870 km) |
| Coverage | One hemisphere, continuously | Most of the Earth at least twice per day |
| Refresh | Full disk typically every 10 minutes, per the Met Office factsheet | Roughly 14 orbits a day, pole to pole |
| Weakness | Steeper viewing angles reduce quality at high latitudes | Gaps between passes |
| Best for | Storm tracking, lightning, nowcasting | Global datasets, soundings, climate research |
The Royal Meteorological Society explains that geostationary satellites orbit once every 24 hours, giving an unbroken series of images, while polar orbiters fly at around 850 km and circle the planet roughly every 100 minutes. The National Weather Service adds that a geostationary satellite can image the same location every 30 minutes, can be commanded to scan every 5 to 15 minutes during severe weather outbreaks, and on very special occasions can image a small area such as a single severe thunderstorm every minute.
The WMO Guide to Instruments and Methods puts the trade-off plainly: polar orbiters at around 800 km give global observations but observe each area usually only twice per day, whereas the geostationary component offers uninterrupted coverage and frequent observing cycles.
For an outdoor event on a Saturday afternoon, the geostationary loop is what you watch as storms develop. For understanding temperature and humidity structure over oceans that feed tomorrow's weather, polar-orbiting sounders matter more.
The products behind the pictures

In the United States, the GOES-R series is the main source. Its Advanced Baseline Imager is, per the OSPO guide, a multi-channel passive imaging radiometer with 16 spectral bands (2 visible, 4 near-infrared and 10 infrared) and spatial resolution of 0.5, 1 or 2 km depending on the band.
The NOAA Virtual Lab lists the Level 2 products distributed operationally. They include:
- Cloud top height, temperature, pressure and phase
- Cloud mask, cloud cover layers, optical depth and particle size
- Aerosol detection and aerosol optical depth
- Derived motion winds and derived stability indices
- Fire detection and fractional snow cover
- Land surface temperature and sea surface temperature
- Rain rate and quantitative precipitation estimate
- Total precipitable water, ice concentration and temperature
Two examples show why these matter operationally. According to NESDIS, the cloud-top height algorithm retrieves height, temperature and pressure for each cloudy pixel from ABI infrared bands, and those products feed aviation Terminal Aerodrome Forecasts, supplement upper-level cloud information from ground-based ASOS stations, and help initialize clouds in numerical weather prediction models. The same page notes that sea surface temperature is provided for each cloud-free pixel over water, which supports seasonal forecasting, ocean and atmospheric modeling, and fisheries management.
Where to get satellite weather data
Most of what ranks for this topic is a viewer: loops from regional National Weather Service offices, university composites and commercial map sites. They are excellent for a quick look. For analysis, you want the underlying data.
The NOAA Open Data Dissemination program makes GOES-16, 17 and 18 data for many instruments and products available on Amazon, Google and Microsoft cloud platforms, and notes that NOAA's collection infrastructure generates tens of terabytes every day. That scale is the practical problem: the data is open, but selecting the right channel, time window, location and processing level takes expertise.
When the data must stand up as evidence, the source and its certification matter. NOAA's National Centers for Environmental Information offers Department of Commerce certified satellite, radar and in-situ data that can serve as evidence in a court of law, and its sector sheet for legal services says certified meteorological data is commonly relied on when weather is a factor in legal proceedings.
What satellite data does well, and how professionals handle its limits
Satellites are indispensable. The Met Office states that around three quarters of existing forecast accuracy results from satellite data, and that satellite information is essential for forecasts, climate monitoring and emergency response. The WMO Guide highlights their ability to make spatially dense observations over the oceans, which removes a major limitation of surface-based networks for global numerical weather prediction.
Every instrument also has characteristics that a trained analyst accounts for:
- Cloud interference. The Met Office says that limitations such as cloud cover affecting infrared soundings are well understood and accounted for in processing, and that multiple satellite types and instruments are used in tandem to fill gaps.
- Low cloud and fog. The Royal Meteorological Society notes that infrared images are available day or night but are not great at picking out low cloud or fog that is a similar temperature to the land.
- Vertical detail. An EUMETSAT and ECMWF evaluation of IASI retrievals found overall quality is good when strict indicators exclude cloudy scenes for temperature retrievals, though retrievals are smooth and can miss fine structure such as low-level temperature inversions.
- Data-rich regions. An ECMWF study found that over the US and Europe, short-range forecast impact from advanced sounders is smaller because conventional observations already constrain initial conditions, while for medium-range forecasts there is a statistically significant benefit from satellite-dominated ocean areas.
The lesson is not that satellite data is unreliable. It is that the right answer usually comes from blending it with radar, surface observations, upper-air soundings and model guidance, and the WMO Guide itself acknowledges that satellites cannot perform every required observation at the necessary quality.
Using satellite data to plan events and manage weather risk
A planner does not need a cloud-top temperature. A planner needs to know whether to hold the 2 p.m. start, when to move spectators to shelter, and when the lightning risk has passed. Satellite data feeds those answers in several ways.
- Early detection of developing storms. Rapid-scan geostationary imagery shows convection building, often before radar shows significant echoes. Rapidly cooling cloud tops signal growth.
- Timing. Motion winds and cloud tracking help refine when a front, a smoke plume or a dust layer arrives.
- Context for radar. Radar sees precipitation. Satellite shows the cloud shield, the clearing behind it and the next system offshore.
- Hazard detection. Fog, smoke, aerosol and fire products matter for outdoor logistics, aviation-adjacent operations and air quality.
- Lead time. Sea surface temperature and precipitable water inform how much moisture a coastal system can draw on.
For logistics, the same imagery supports route and schedule decisions: staging equipment before a winter system, timing a lift or crane operation around wind, or deciding when a marine transfer window closes. In each case the value lies in a clear recommendation tied to your thresholds, not in the image.
Reconstructing weather after the fact
When a loss occurs, the question reverses: what did the weather do at this exact location and time? Satellite data is one of several layers. A forensic analysis typically pairs satellite imagery and derived products with radar, nearby surface stations and certified records to establish whether hail, high wind, flooding rainfall or lightning plausibly affected a property.
Because NCEI certified data is designed to serve as evidence, a reconstruction can rest on records a court recognizes. The meteorologist's job is to select the right sources, explain their resolution and uncertainty, and tie them to the facts of the case. For how that translates to testimony, see our guide to what a meteorologist does in court as a weather expert witness.
Perspective: why raw satellite data is not an answer
We see the same pattern with event organizers, attorneys and insurers. They arrive having already looked at a satellite loop, and the loop is rarely the problem. The problem is the step after it: deciding what the imagery means for a specific site, a specific hour and a specific decision.
Our view is that high-impact weather deserves a certified consulting meteorologist who can combine satellite observations with radar, surface data and model guidance, and then say plainly what to do. That is why we built our services around direct access to expertise and same-day analysis, with deliverables tailored to the client rather than a generic feed.
For events, that means forecasts framed around your thresholds. For legal and insurance matters, it means reports and testimony that explain the weather in terms a judge, adjuster or jury can follow. For businesses and emergency managers, it means risk mitigation and planning grounded in what the atmosphere can realistically deliver.
Preparedness has an urgency that a free map cannot supply. Data tells you what is happening. A meteorologist tells you what it means for you.
Michael
How we can help
We are WeatherPrep, a consulting practice staffed by certified consulting meteorologists. If your decision depends on satellite and other weather data, we turn it into a specific recommendation or a defensible report. Our work covers event forecasting, expert witness testimony, risk mitigation, emergency plans and rapid turnaround analysis, and our forensic reports support legal and insurance matters, including for lawyers in New York and New Jersey. Same-day analysis is part of how we work, and services can be customized to the engagement.

Tell us the site, the date and the decision you need to make, and we will scope the right level of support, from a forecast to on-site meteorology for an outdoor event.
How to read a satellite image with more confidence
If you are reviewing imagery yourself, a few habits prevent common misreadings.
- Check the band. Visible imagery disappears at night. Infrared shows temperature, so a cold, bright cloud top is high and often vigorous, but a warm low cloud may barely register.
- Note the time stamp and scan sector. Full-disk, regional and small-sector scans refresh at different rates, as the NWS description of commanded rapid scans shows.
- Mind the viewing angle. Geostationary quality falls off at high latitudes because of steeper angles.
- Separate observation from estimate. A rainfall rate from a satellite is an estimate derived by an algorithm. Compare it with radar and gauges before relying on it.
- Match the product to the question. Cloud-top temperature answers questions about storm intensity. Derived motion winds answer questions about flow. Land surface temperature answers questions about heat on the ground.
FAQ
Is satellite weather data free?
Much of it is. NOAA makes GOES data available through its open data program on major cloud platforms, and agencies publish public viewers. Processing it into something decision-ready, or obtaining certified copies for legal use, takes additional expertise.
What is the difference between satellite and radar data?
Radar detects precipitation from the ground by bouncing energy off raindrops and hail. Satellites observe clouds, temperature, moisture and surface features from above across large areas, including oceans where radar does not reach. Forecasters use them together.
How often is satellite imagery updated?
It depends on the satellite and scan mode. Geostationary satellites sample the full disk about every 10 minutes according to the Met Office, and the National Weather Service says they can scan small areas every 5 to 15 minutes in severe weather. Polar orbiters pass over a given area roughly twice per day.
Can satellite data be used in court or an insurance claim?
Yes, when it is properly sourced and interpreted. NCEI provides certified satellite, radar and in-situ data for evidentiary use. A meteorologist then explains what the data shows for the specific location and time in question.
What can satellites not see well?
Infrared sensors can struggle with low cloud or fog near land temperature, and infrared soundings are affected by cloud cover. Retrievals can also miss fine vertical structure. Combining satellite types with surface and radar data fills these gaps.
Sources
- Seeing the bigger picture: How satellite data shapes Met Office forecasts
- The role of satellites in weather forecasting, Royal Meteorological Society
- Satellites factsheet, Met Office
- Satellites, National Weather Service
- NESDIS, National Environmental Satellite, Data, and Information Service
- GOES-R Series Data Products, NESDIS
- GOES-R L2s, NOAA Virtual Lab
- Beginner's Guide to GOES-R Series Data, NOAA OSPO
- Guide to Instruments and Methods, WMO
- Quantifying the benefit of the advanced infrared sounders AIRS and IASI, ECMWF
- IASI Level 2 evaluation report, EUMETSAT and ECMWF
- NCEI sector sheet for legal services, NOAA
- NCEI Data in the NOAA Open Data Dissemination Program